Why Does an EV Battery Charge More Slowly After 80%?
Explore the charging curve, battery management, cell balancing, temperature and average power behind the slowdown near a full battery.
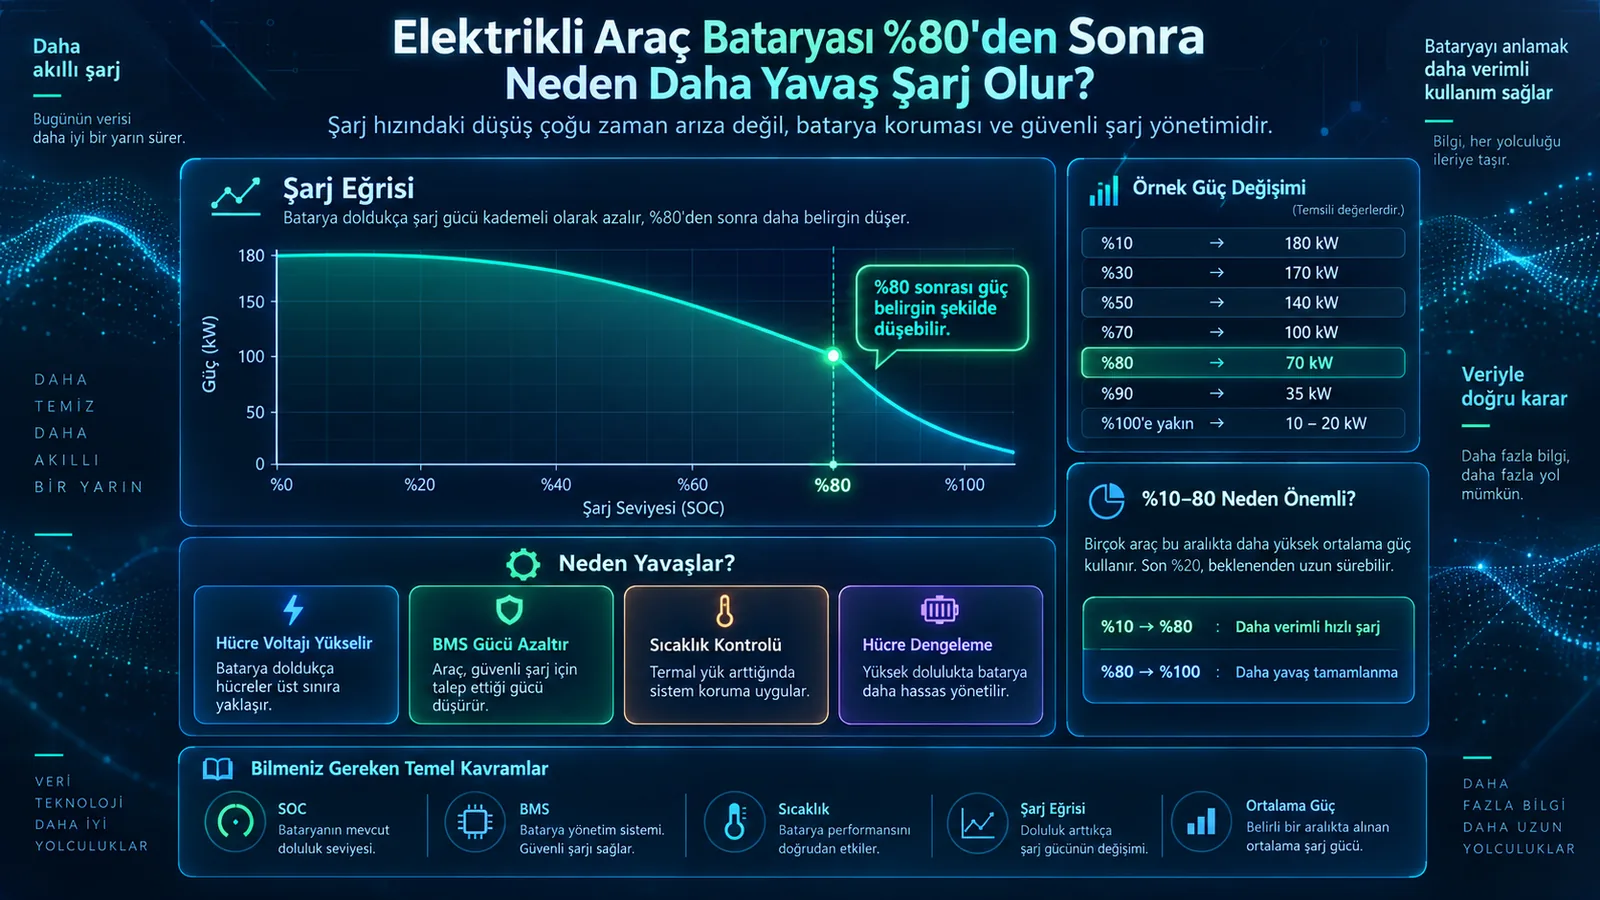
Table of contents
Why Does an EV Battery Charge More Slowly After 80%?
An EV can charge quickly at the start of a DC session and then slow down as the battery fills. It might draw high power from 10% to 40%, a moderate level from 40% to 70%, and far less above about 80%. This usually does not mean the station is faulty. The vehicle often reduces its power request to charge the battery safely.
Why is 80% often mentioned?
Battery cells cannot accept the same charging power from empty to full. As state of charge rises, the vehicle generally asks for less power. 80% is a useful reference, not a universal technical threshold. One vehicle may start reducing power around 60% or 70%; another may hold a higher rate beyond 80%.
Who reduces the charging power?
The vehicle’s battery management system (BMS) monitors cell voltages, battery temperature, state of charge, current limits and battery health. It tells the station what the battery can accept. The station then adjusts output to the vehicle’s request rather than imposing its own maximum rating.
Why is more care needed near full charge?
As battery cells fill, their voltages approach upper limits. Continuing at high current could increase heat, cell imbalance and battery stress. Reducing power helps keep the process controlled and within the battery’s safe operating limits.
What is a charging curve?
A charging curve shows how charging power changes with battery state of charge. An illustrative curve might look like this:
| State of charge | Charging power |
|---|---|
| 10% | 180 kW |
| 30% | 170 kW |
| 50% | 140 kW |
| 70% | 100 kW |
| 80% | 70 kW |
| 90% | 35 kW |
| Near 100% | 10–20 kW |
These are example values, not specifications for a particular car. Every vehicle has its own curve.
Why can the advertised peak be misleading?
A vehicle advertised at 180 kW maximum DC charging may reach that peak only briefly. It might draw 180 kW at 10–25%, then 150 kW at 25–50%, 110 kW at 50–70%, 80 kW at 70–80% and 30–60 kW thereafter.
Peak power alone cannot explain the overall session. Average charging power over the part of the battery you intend to fill is often more informative. A car that briefly reaches 200 kW but quickly falls to 80 kW can finish 10–80% more slowly than one that holds 140–160 kW for longer despite a lower peak.
Why do manufacturers quote 10–80% time?
Many EVs can sustain higher average power in that range than near full charge. One car might take 25 minutes from 10% to 80%, then another 25 minutes from 80% to 100%. The final 20 percentage points can therefore take as long as the preceding 70.
On a long journey, waiting for 100% at every stop may not be the fastest strategy. The useful stop level depends on the next charger, route and vehicle.
What happens near 100%?
The system reduces current and pays close attention to cell voltages and differences between cells. A battery pack contains many cells, which may not all be at exactly the same voltage. The BMS may perform cell balancing to keep the pack operating safely and efficiently. These controls can make the final part of charging slower.
How does temperature affect the curve?
A battery that is too cold or too hot may accept less power even at a low state of charge. A car that can normally draw 150 kW at 20% might request only 60 kW when the pack is very cold.
High-power charging also generates heat. Vehicles use thermal-management systems, including liquid or air cooling, to control battery temperature. If temperatures rise too far, charging power may be reduced.
Some vehicles offer battery preconditioning when a fast charger is selected in navigation. Preparing the battery before arrival can help it accept more power and may shorten the session, particularly in cold weather.
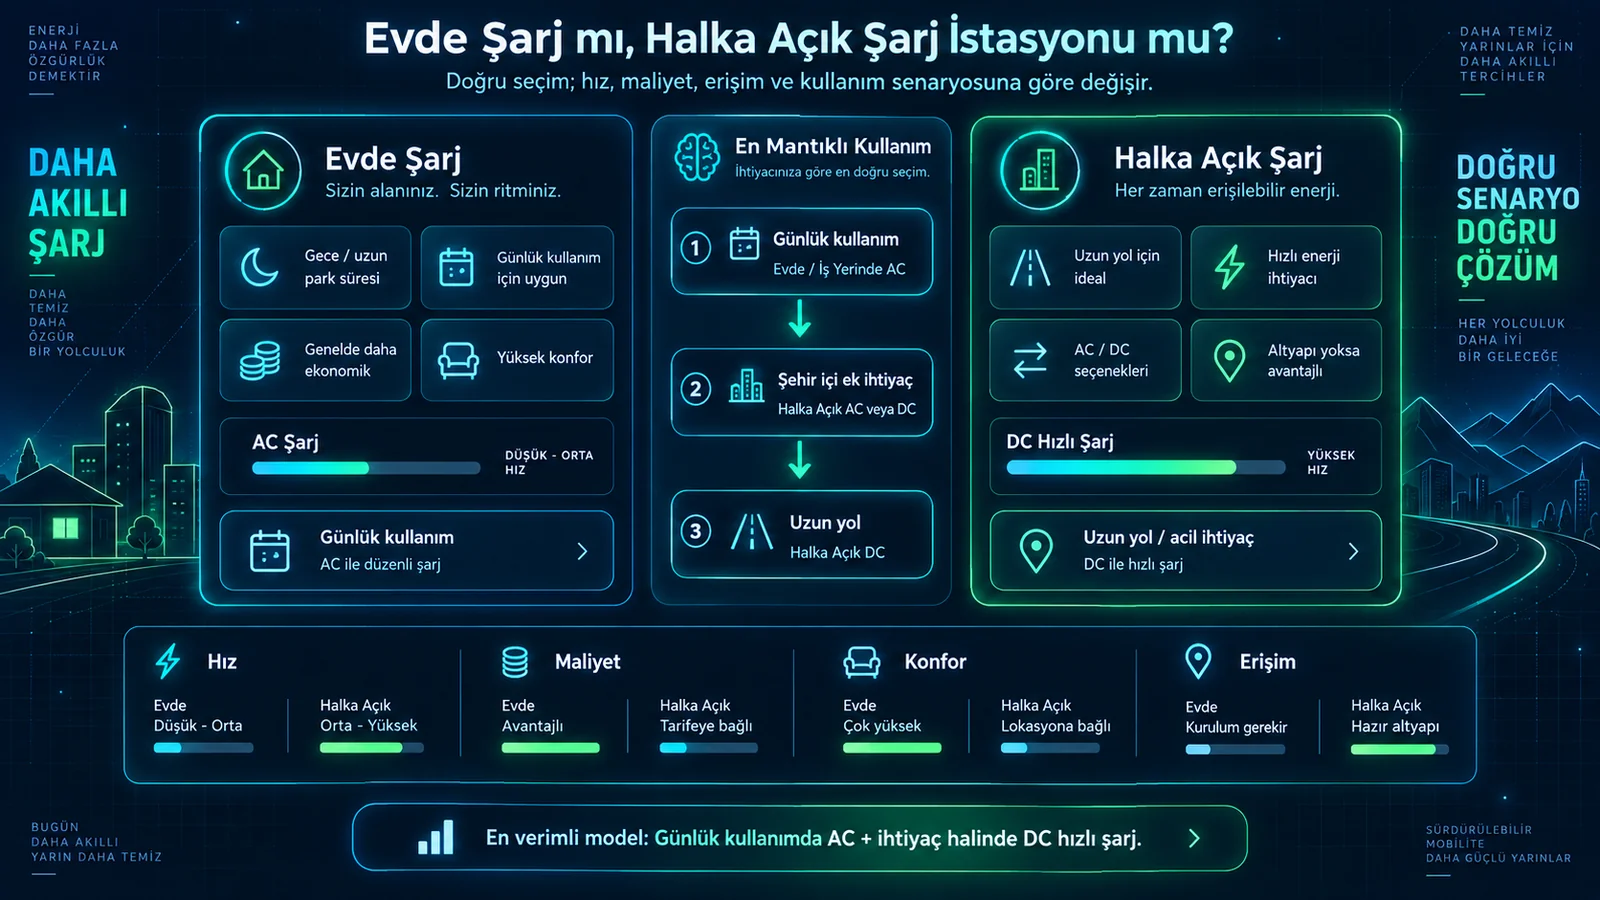
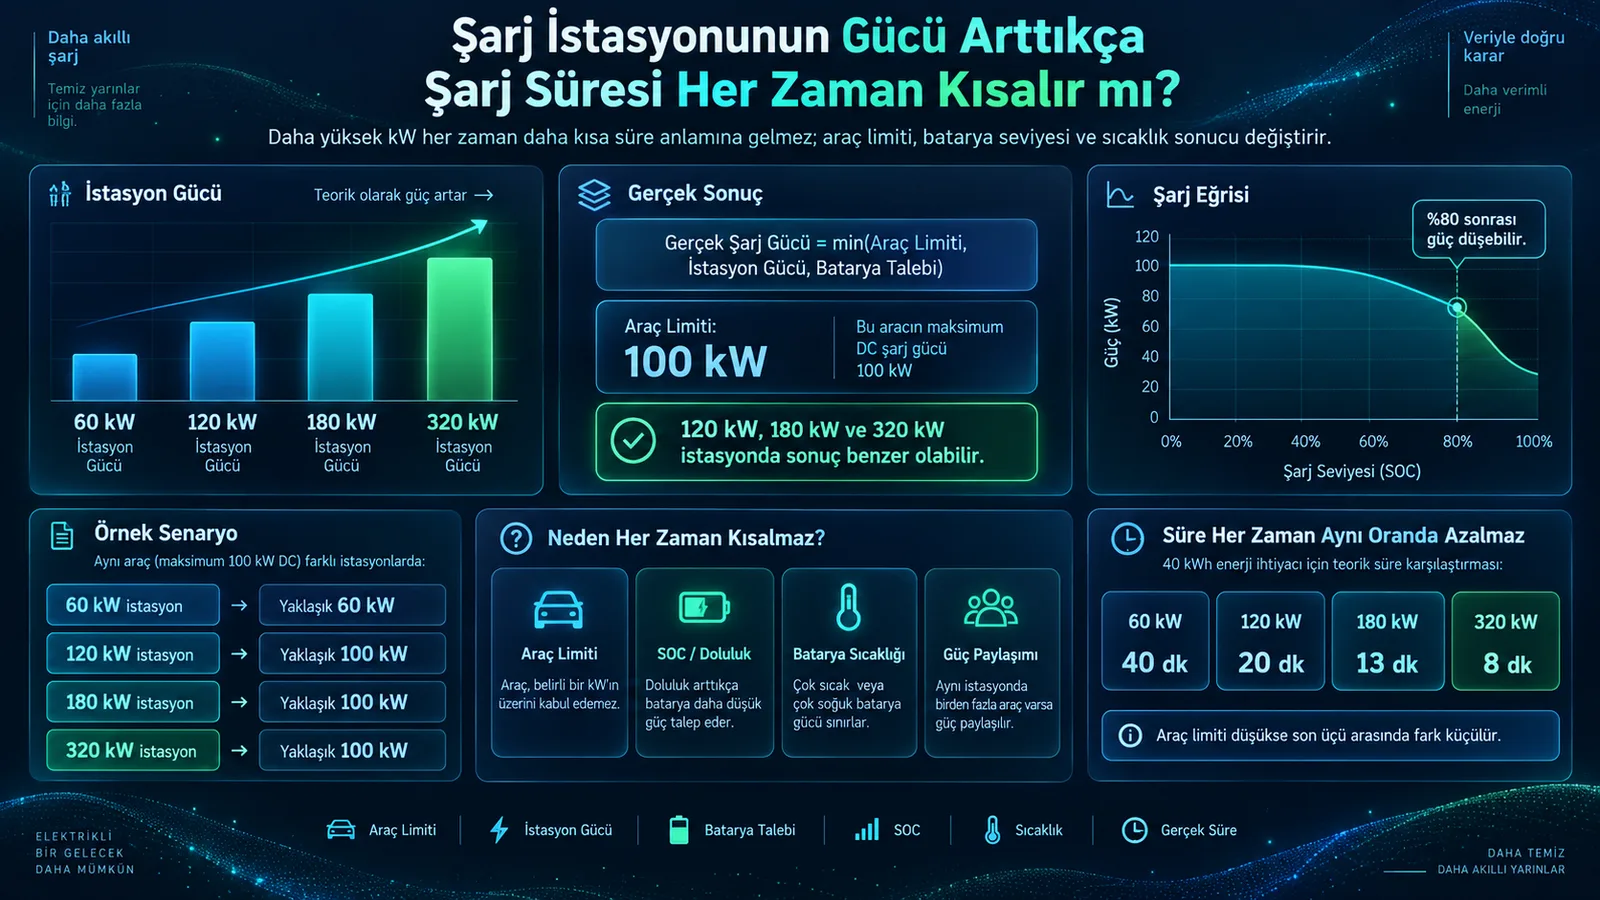
Why does a 90%-charged car draw only 40 kW on a 320 kW station?
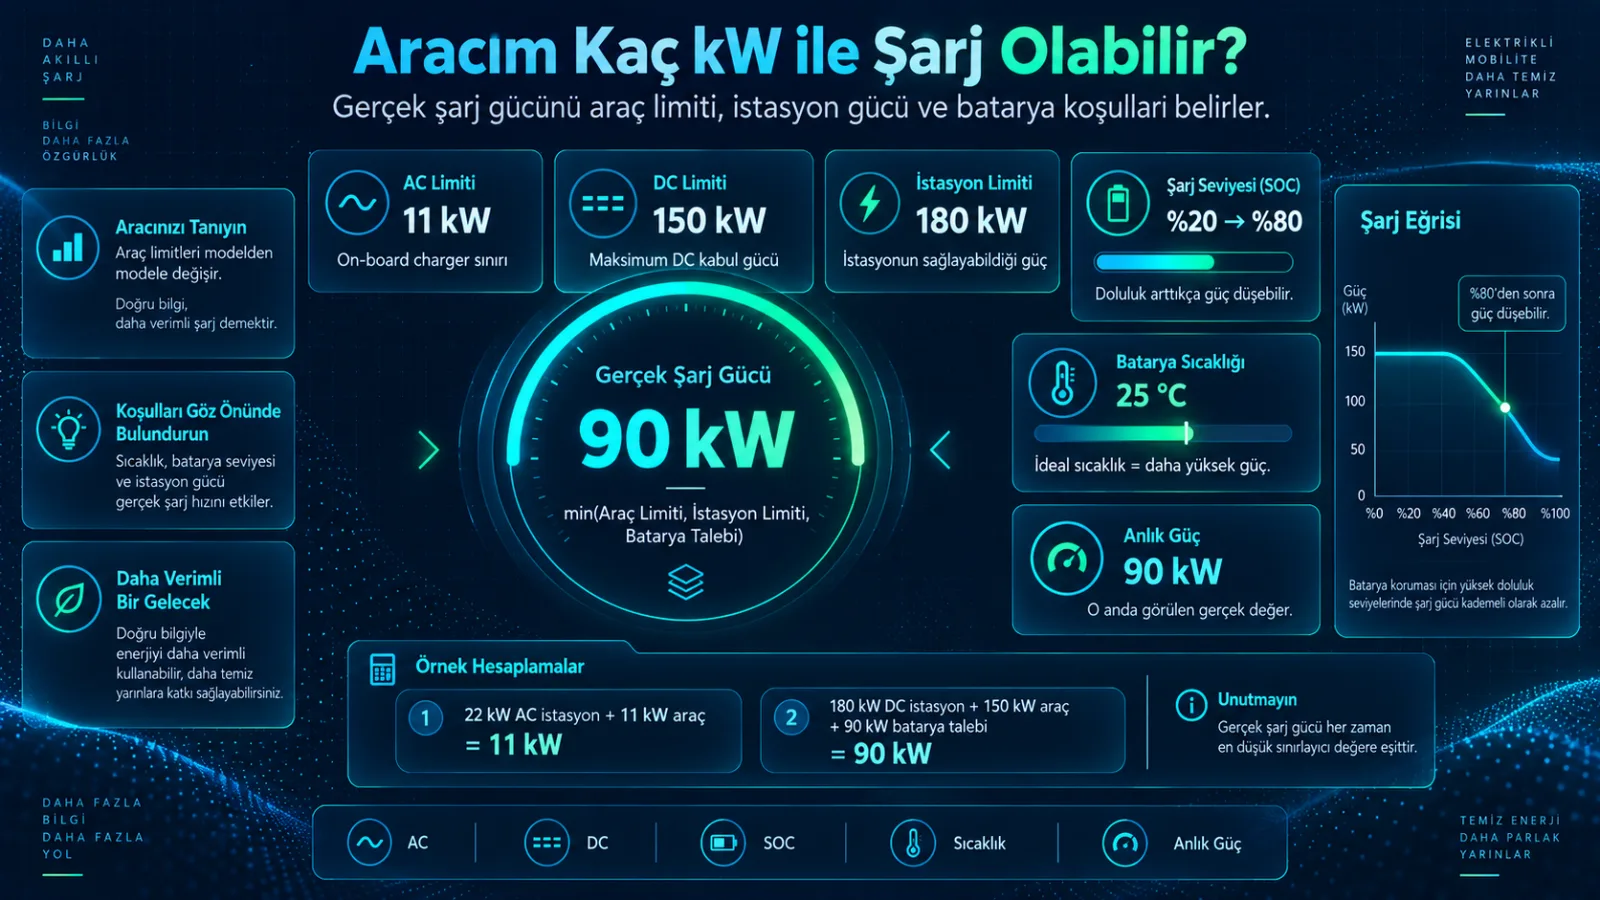
Suppose the station supports 320 kW and the car can peak at 200 kW, but its battery at 90% requests just 40 kW. Actual charging may be around 40 kW. A larger station cannot override the battery’s current limit.
The displayed rate can fall from 150 to 120 to 80 kW as the car changes its request. It may occasionally rise again if battery temperature improves or more station power becomes available, but the general tendency at high states of charge is downward.
Why do different cars behave differently at 80%?
Battery chemistry, voltage architecture, cell design, cooling and the manufacturer’s charging strategy vary. One model might accept 45 kW at 80%, while another accepts 80 or 110 kW. Chemistries such as NMC, NCA and LFP can have different characteristics; do not assume a single curve applies to every EV.
Is charging to 100% harmful?
Charging to 100% is not automatically “harmful”; manufacturers design vehicles to manage it. However, keeping some battery chemistries at a high state of charge for long periods can add stress. Follow the vehicle maker’s advice for everyday charge limits. A full charge before a long trip may be useful when the route calls for it.
Is waiting for 100% on a road trip worthwhile?
Sometimes, but not always. Imagine 10–80% takes 25 minutes and 80–100% takes another 25. A route with a shorter first stop and another 15-minute stop later might take less total charging time. Availability and spacing of chargers still matter.
How do you read a charging-curve graph?
The horizontal axis usually shows state of charge (SOC); the vertical axis shows charging power (kW). Look at the whole curve, not just its highest point. A useful fast-charging curve remains relatively high for a substantial part of the session before gradually tapering.
Is low power above 80% a fault?
Not by itself. A car receiving 40 kW at 85% may be operating normally. If a car at 20% with a suitably warm battery and sufficient station capacity receives far below its usual rate, investigate other limits or a possible fault.
What can drivers do to reduce charging time?
Start fast-charging sessions at a lower state of charge when practical, use preconditioning if the vehicle supports it, learn its charging curve and select a station with a suitable rating. A station far below the vehicle’s capability can slow the session; one far above it may add little benefit.
Operators should also consider the vehicles and arrival charge levels typical of their site. A 320 kW investment may not produce the expected speed improvement if most users arrive with nearly full batteries.
Conclusion
Slower charging above about 80% is usually normal. The BMS lowers its request as cell voltage, heat and balancing become more important. When the battery is low, speed matters; as it approaches full charge, control and safety take priority. Compare charging curves, 10–80% times and average power rather than peak kW alone.
About the author
Charge Teknoloji
Charging Infrastructure Team
Charge Teknoloji develops locally manufactured DC charging stations and OCPP-compatible charging network software.
LinkedIn arrow_outwardBe the first to hear about updates
Follow new content on electric vehicles and charging technologies.